Isobars
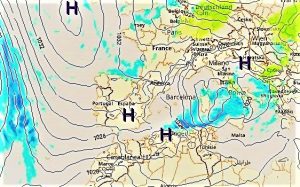
In meteorology, it is very important to know the atmospheric pressure behavior, the wind force and its direction in a given geographical area. In this sense, there are maps that show these climate elements through graphical representations called isobars, which are drawn as lines that indicate the pressure in a given space. These lines allow the identification of anticyclonic or depression zones. It should also be noted that these lines are drawn from the data generated by meteorological analyses carried out at the measuring stations.
What are isobars?
Generally, the term isobar tends to be used as a noun designating a curve that represents pressure points on a map, graph, or plot in order to accurately identify. It is also important to note that the word isobars can also refer to a surface on which the pressure maintains the same value at any point. In that sense, it is important to distinguish an isobar line that can be drawn on any non-isobar surface from an isobar surface on which isobar lines may not appear, since the pressure is constant at any point.
The term isobar is a compound word that comes from the Greek and means “Iso” equal and “bar” weight. In this sense, isobar is defined as a line that encompasses areas where atmospheric pressure is equal.
History of isobars
In the history of cartography, isobars are a type of isolines, i.e. curved or straight lines that connect geographical points where the function has the same constant value. In the case of isobars the function is atmospheric pressure.
Meteorological maps originated in the mid-19th century in the United States. The American physicist Joseph Henry was the first to exhibit a weather forecast map on the Ohio River from the Atlantic coast.
At present, meteorological maps with their isobar records are of great help in the marine and air transport industry since this type of cartography allows us to know if there are adequate conditions to make trips by sea or air without the lives of crew members being at risk.
What are isobars for?
Isobars give information about the direction and force of air masses in a given area.
In meteorological maps they are represented as lines that join all the points where the atmospheric pressure is equal. The atmospheric pressure is measured in millibars. The isobars measure in intervals of 4 millibars. A normal pressure is in the range of 1013 millibars, while high or low pressures are in ranges greater or less than 1013 millibars.
Isobar maps
The isobar maps draw geographic spaces where the atmospheric pressure behavior is represented, the wind force and the direction it takes in the spaces described in the map.
On the geographical area of the map, are placed isobar lines or pressure isograms, which are curves that group the points that have an equal or constant atmospheric pressure.
In the meteorological maps different types of curved lines can be identified, the isobars, the allobars that can delimit the change of atmospheric pressure in a determined area. If the change of pressure is positive, the curved lines will be called anallobar, but if this change is negative it will be called catalobar.
The value of isobars is expressed in millibars or hectopascals (hPa) (1 hectopascal = 1 millibar).
Interpretation
In order to interpret isobar maps, it is important to identify the wind behavior and atmospheric pressure through the proximity or distance of pressure lines in specific areas of the mapping represented.
If the lines are too close together, it means that the wind will blow strong, that pressure changes occur quickly and that there is a big difference in atmospheric pressure over a small space. If, on the other hand, the curved lines are too far apart, the force of the wind will be reduced, the pressure changes will occur slowly and there will be a balanced pressure in a larger space.
In an isobar map (pressure map), the low pressure center is identified by the letter B while the high pressure center is identified by the letter H.
To read an isobar map is important:
- Learning the basic principles of rainfall
- Know how to interpret the actions that occur as a result of changes in atmospheric pressure.
- Know the symbols of atmospheric pressure.
- To interpret the behavior of high pressure systems.
- To interpret the behavior of low pressure systems.
- Recognize the movements and types of fronts (cold, hot and occluded).
- Analyze the behavior of hot fronts.
- Analyze the behavior of cold fronts.
- Analyze the behavior of occluded fronts.
How to cite this article?
Briceño V., Gabriela. (2019). Isobars. Recovered on 4 January, 2025, de Euston96: https://www.euston96.com/en/isobars/


